
By Saeed Mirshekari
February 27, 2023
What Is Customer Attrition?
Customer Attrition is the fancy way of saying "customer leakage". This metric is used to understand how many customers are leaving the business. It can be calculated using time series techniques in Python, using pandas. This tutorial will show you how to compute this metric on customer data given in a csv file, without any Tableau workbook.
Why Does It Matter?
Customers are the life of any business and therefore it's important to know retention rate of customers. This is where customer attrition comes in, which is a very popular metric used in retail businesses. In this article, you will learn how to compute customer attrition in pandas.
This is a question I have never received, but it can be helpful for a small business understanding their customer base. If you notice high attrition over time, you can use this formula to identify what is causing that attrition.
It is not an easy task though. There are some tricks. In this post we will learn how to calculate customer attrition in pandas. So let's get started!
The Input Data
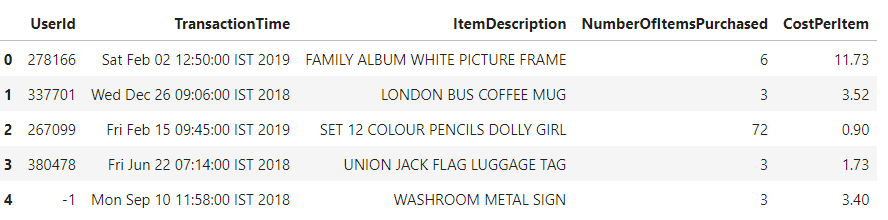
We will show you the details steps in a real example of a data science project, and see how we can use the results. I am going to be using the Transaction Data dataset from Kaggle to demonstrate how to compute customer attrition.
Here is a snapshot of the input data for you to see what we are dealing with:
The Expected Output
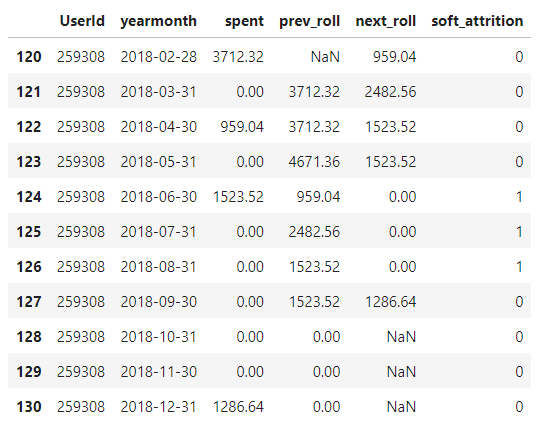
It is always nice to have a clear idea of the expected output shape of the data. For computing the Customer Attrition here is what we would expect as the output:
Data Manipulations
We have transactions for an e-commerce website, and we need to identify users' spending decrease (soft attrition problem).
Before we get into the python scripts that takes the input data and returns the expected output as described above, let's review the main steps along the way in data manupulation to set things up to compute the attrition:
-
Read the transaction table from the input file.
-
Clean up data removing duplicate data and userid = -1
-
Calculate the "aggregated_table" with each month's dollar value of transactions per user. (hint: what happens if a user does not have transactions in month X?)
-
Now that things are ready for the final step, we add a new column, "soft_attrition", to aggregated_table, which is "1" if the total amount of transactions in the next three months is less than 25% of the past three months; otherwise, it is "0".
Here is the python scripts you need to compute the Customer Attrition:
Summary
If you're just getting started with data analysis, you will quickly come to realize the importance of computing customer attrition. It's a critical aspect of any business to have an understanding of customer retention metrics, and pandas makes the process extremely easy.
In this tutorial I showed you how to compute customer attrition in pandas using some basic pandas functions.
I hope this was useful! To see more content like this subscribe to O'Fallon Labs or check out this website again.

Saeed Mirshekari
Saeed is currently a Director of Data Science in Mastercard and the Founder / Director of OFallon Labs LLC. He is a former research scholar at LIGO team (Physics Nobel Prize of 2017).