
By Saeed Mirshekari
September 4, 2023
Unveiling Unsupervised Model Evaluation: Cost Functions and Performance Metrics
Unsupervised learning is a captivating field in data science, where algorithms uncover hidden patterns and structures within data without the need for labeled targets. But how do we measure the performance of unsupervised models when traditional metrics like accuracy and precision aren't applicable? In this comprehensive guide, we'll delve into the fascinating world of cost functions and innovative techniques to assess the effectiveness of unsupervised models. Whether you're an aspiring data scientist or a junior practitioner, this article will equip you with the knowledge to navigate the intricacies of unsupervised model evaluation.
Table of Contents
-
The Challenge of Unsupervised Model Evaluation
-
Clustering Evaluation Metrics
- Silhouette Score
- Davies-Bouldin Index
- Adjusted Rand Index
- Mutual Information
-
Dimensionality Reduction Evaluation Metrics
- Explained Variance Ratio
- Reconstruction Error
-
Cost Functions in Unsupervised Learning
-
Implementing in Python
-
Conclusion
The Challenge of Unsupervised Model Evaluation
Unsupervised learning tasks, such as clustering and dimensionality reduction, lack explicit labels or ground truth for model evaluation. This presents a unique challenge: How can we measure the quality of unsupervised models objectively?
Traditional classification and regression problems have well-defined metrics like accuracy, precision, and mean squared error, but these metrics rely on labeled data. In unsupervised learning, where no labels are available, we need alternative techniques to gauge model performance.
Let's explore these innovative evaluation techniques and metrics that can help us assess unsupervised models.
Clustering Evaluation Metrics
Silhouette Score
The Silhouette Score measures the similarity of each data point to its own cluster compared to other clusters. It ranges from -1 to 1, where a higher value indicates better-defined clusters.
Mathematically, for each sample:
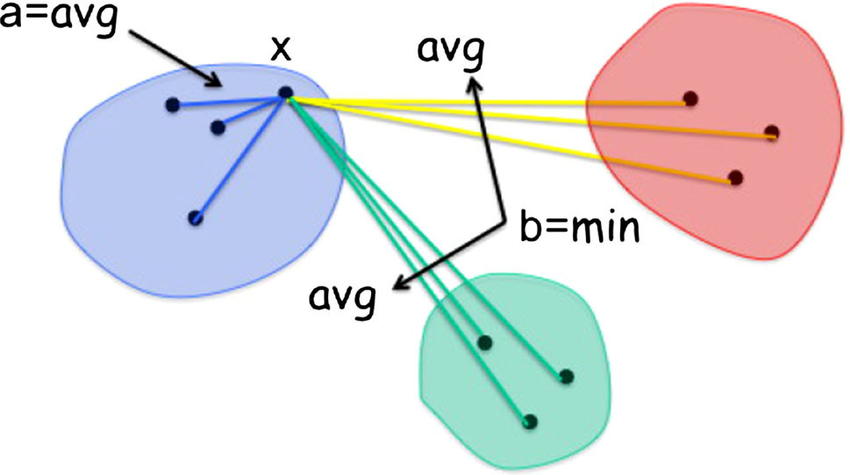
$a$ is the average distance from the sample to other points in the same cluster.$b$ is the smallest average distance from the sample to points in other clusters.
The silhouette score for a dataset is the average silhouette score for all samples.
A Silhouette Score close to 1 suggests that the object is well-suited to its own cluster and poorly suited to neighboring clusters. A score close to 0 means that it's on or very close to the decision boundary between two neighboring clusters, and a score close to -1 indicates that the object is poorly suited to its own cluster and well-suited to neighboring clusters.
Davies-Bouldin Index
The Davies-Bouldin Index measures the average similarity ratio of each cluster with the cluster that is most similar to it. Lower values indicate better clustering.
For each cluster $i$, the Davies-Bouldin Index calculates:
$R_i$ as the average distance from each point in cluster $i$ to the centroid of cluster $i$.$S(i, j)$ as the distance between the centroids of clusters $i$ and $j$.
The Davies-Bouldin Index for cluster $i$ is defined as the maximum similarity ratio:
\begin{equation}
DB(i) = \max_{j \neq i} \left(\frac{R_i + R_j}{S(i, j)}\right)
\end{equation}
The Davies-Bouldin Index is the average of the similarity ratios for all clusters.
A lower Davies-Bouldin Index indicates better clustering, with a value of 0 indicating perfectly separated clusters.
Adjusted Rand Index
The Adjusted Rand Index (ARI) measures the similarity between the true labels and the predicted clusters, correcting for chance. It ranges from -1 to 1, where a higher value indicates better clustering.
The ARI compares all pairs of samples and counts pairs that are assigned to the same or different clusters in both the true and predicted clusterings. It then calculates the Rand Index, which is adjusted for chance.
An ARI close to 1 suggests a perfect match between true labels and predicted clusters, while a score close to 0 indicates random clustering.
Mutual Information
Mutual Information measures the amount of information shared between the true labels and the predicted clusters. Higher values indicate better clustering.
Mutual Information considers the joint distribution of true labels and predicted clusters, measuring how much knowing one variable reduces uncertainty about the other.
Dimensionality Reduction Evaluation Metrics
Explained Variance Ratio
When dealing with dimensionality reduction techniques like Principal Component Analysis (PCA), the explained variance ratio can provide insights into how well the model captures the data's variation. It tells us the proportion of the total variance in the data that is explained by each principal component.
The explained variance ratio for the (i)-th principal component is calculated as the ratio of the variance of the (i)-th component to the total variance.
A high explained variance ratio for the first few principal components indicates that the model retains most of the data's information in a lower-dimensional space.
Reconstruction Error
In the context of dimensionality reduction, reconstruction error measures how well the reduced-dimensional data can be reconstructed back to its original form. The lower the reconstruction error, the better the model captures the essential features of the data.
For techniques like autoencoders, the reconstruction error is the mean squared difference between the input data and the reconstructed data.
Cost Functions in Unsupervised Learning
While cost functions are typically associated with supervised learning, they can also play a role in unsupervised learning, particularly in generative models like Variational Autoencoders (VAEs) and Gaussian Mixture Models (GMMs).
In VAEs, the cost function often involves both a reconstruction loss (measuring how well the model can reconstruct the input data) and a regularization term (encouraging the learned latent space to follow a specific distribution).
In GMMs, the cost function involves the log-likelihood of the data given the model parameters. Maximizing this log-likelihood leads to better clustering in GMMs.
Implementing in Python
Let's implement these evaluation metrics and techniques in Python, using scikit-learn and other libraries. We'll walk through examples for both clustering and dimensionality reduction.
Clustering Evaluation Example (K-Means):
import numpy as np
import matplotlib.pyplot as plt
from sklearn.datasets import make_blobs
from sklearn.cluster import KMeans
from sklearn.metrics import silhouette_score, davies_bouldin_score, adjusted_rand_score, mutual_info_score

# Generate synthetic data with 3 clusters
X, y = make_blobs(n_samples=300, centers=3, random_state=42)

# Fit a K-Means clustering model
kmeans = KMeans(n_clusters=3, random_state=42)
labels = kmeans.fit_predict(X)

# Evaluate clustering using metrics
silhouette = silhouette_score(X, labels)
davies_bouldin = davies_bouldin_score(X, labels)
ari = adjusted_rand_score(y, labels)
mi = mutual_info_score(y, labels)

# Print results
print(f'Silhouette Score: {silhouette:.2f}')
print(f'Davies-Bouldin Index: {davies_bouldin:.2f}')
print(f'Adjusted Rand Index: {ari:.2f}')
print(f'Mutual Information: {mi:.2f}')
Dimensionality Reduction Evaluation Example (PCA):
import numpy as np
from sklearn.datasets import load_iris
from sklearn.decomposition import PCA
import

 matplotlib.pyplot as plt

# Load the Iris dataset
iris = load_iris()
X = iris.data

# Fit PCA to the data
pca = PCA(n_components=2)
X_reduced = pca.fit_transform(X)

# Calculate explained variance ratio
explained_variance_ratio = pca.explained_variance_ratio_

# Plot the explained variance ratio
plt.bar(range(len(explained_variance_ratio)), explained_variance_ratio)
plt.xlabel('Principal Component')
plt.ylabel('Explained Variance Ratio')
plt.title('Explained Variance Ratio for Principal Components')
plt.show()
Conclusion
Unsupervised learning poses unique challenges for model evaluation due to the absence of labeled data. However, innovative techniques and metrics, such as Silhouette Score, Davies-Bouldin Index, Adjusted Rand Index, Mutual Information, Explained Variance Ratio, and Reconstruction Error, provide valuable insights into the performance of clustering and dimensionality reduction models.
Data science enthusiasts and junior practitioners can leverage these tools to assess the quality of unsupervised models effectively. Remember that the choice of metric depends on the specific problem you're tackling and the nature of your unsupervised learning task.
As the field of unsupervised learning continues to evolve, mastering these evaluation techniques will empower you to uncover hidden patterns and structures within data, opening up new possibilities for knowledge discovery and insights. So, dive in, experiment, and use these methods to unlock the potential of unsupervised learning in your data science journey.